Selected work · Product walkthrough
Business KPIs, ready for mobile
Operational visibility for managers on the move.
What we delivered
Created mobile-ready dashboards for revenue, collections, stock and sales performance so decision makers can track operations without waiting for manual reports.
Technology
Flutter · REST APIs · Dashboards
Operational outcome
Faster access to the numbers that drive decisions.
Inside the product
A closer look at the workflow
The screen below shows the desktop reporting view of the business platform, illustrating the operational indicators discussed in this case study. It is not a screenshot of the Flutter mobile application.
Select a screenshot to view it at full size. Screens are shown in their original French interface.
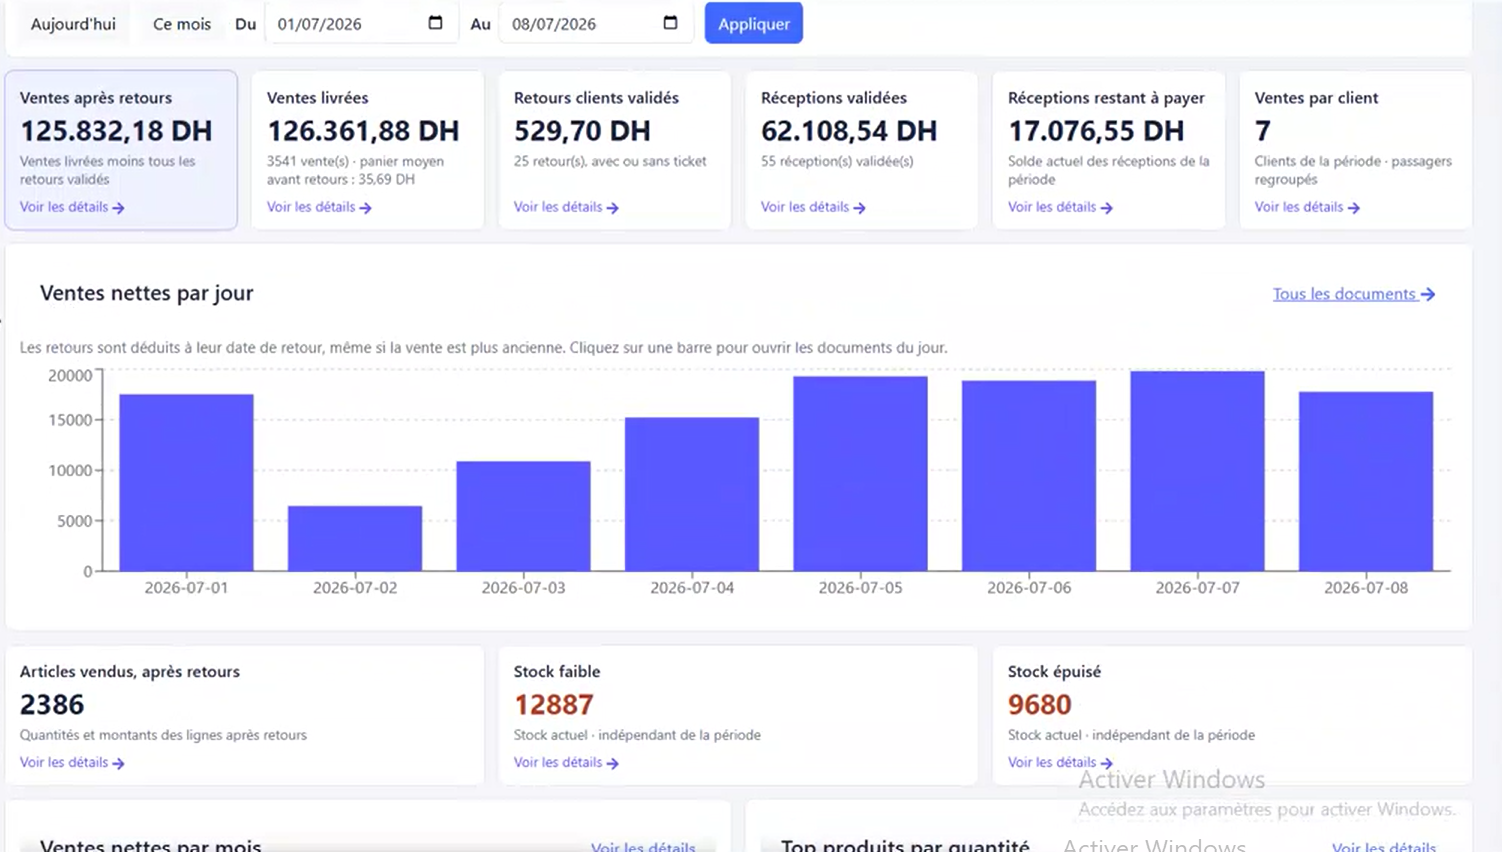
Sales and stock at a glance
This desktop reporting view brings together net sales, returns, goods receipts and stock alerts. A daily sales chart and date filters help managers review activity over a selected period.
Working through a similar challenge?
Tell us about your existing systems, the delivery blocker and what needs to work better.
Discuss your project ↗